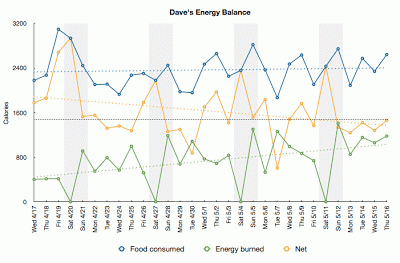
Here's the updated graph of my energy balance for the entire period:
I've made one significan modification from last time: Instead of just averaging the plots for each measure, I've inserted trendlines. So you can see that while my consumption has stayed pretty much flat, I've been burning progressively more calories over the course of the diet. That means net consumption, which is just food consumed minus energy burned, has actually been decreasing over the course of the diet.
So why has my weight loss stalled? It's possible that I simply measured at a point that was artificially low last time. In fact I had a period when my weight went up during this period. Here's the full graph of my weight over the course of the diet:
For an example of the kind of workouts I've been doing lately, see below.
Yesterday I did my first speed workout since Boston, a 6*800 that left me nearly completely spent. But I was able to keep all the splits under 2:55, which isn't bad, considering! I followed that up with another run in the afternoon, and then did 6 miles plus weights today. Here's hoping the lifting will result in some benefits both in weight loss and strength gains. The Garmin plot below is the 6*800s.


Hi! Thanks for the great information you havr provided! You have touched on crucuial points!
ReplyDeletefat loss factor